This is the first of a two-part post on K-means clustering.
Introduction
Unsupervised Learning
I've talked about unsupervised learning before when dealing with Self-Organising Maps, but just to recap. Unsupervised learning is when you have a dataset of features with no pre-defined outcomes. You give it to an algorithm to learn patterns in the data without knowing in advance what associations you want it to learn.
So you're not trying to teach it to tell the difference between images of cats and dogs; instead, you're trying to make it learn something about the structure of the images, so it can find similar images without explicitly knowing about cats and dogs.
K-means is a type of unsupervised learning method, specifically a type of clustering.
Clustering
Clustering deals with finding groups of similar data points.
There are two criteria that make a "good" set of clusters:
- Intra-cluster similarity. That is, all the data points within a cluster should be similar to each other (we'll deal with what 'similar' means a bit later).
- Inter-cluster dissimilarity. That is, data points in one cluster should be sufficiently different from data points in another cluster.
This is also what we're trying to achieve with k-means. It is only one of the many types of clustering algorithm, but I've chosen it as it's popular as well as being easy to understand and implement.
Uses of Clustering
What are some uses of clustering?
Finding similarities in your data that you couldn't do by inspection has a lot of uses. The classic example is "segmenting your customer base", that is identifying customers with similar buying behaviours for better targeted advertising. Another form of clustering, hierarchical clustering, is used in astronomy. You can even use it to find similar boroughs in London based on house-buying behaviour.
Potential Problems
Choosing K
Before you start training your data to learn the clusters, you need to choose a value for $k$. That is, you have to decide beforehand how many groups there are going to be. This sounds like it defeats the purpose of being unsupervised, and it is indeed something that you have to set manually.
Due to the random nature of the initialisation of the algorithm, and the uncertainty in the correct value for $k$, you might find re-running the algorithm multiple times gives you different results.
Subjective Evaluation
As with unsupervised algorithms in general, evaluating the outcome is partly subjective. There are objective measures with which we can compare different runs, but the final evaluation will be based on which one feels best.
Sometimes you can look at the characteristics of the clusters to see which one makes most sense. For example, if segmenting your customers into clusters results in two clusters that both contain mostly customers over 60, you might choose another run that better separates your customers based on age. Of course, the clusters will be created based on your data, so if there really are two distinct groups of over-60 customers then no amount of runs will change that!
The K-means Algorithm (with words)
Clusters have two properties: a centroid and a set of your data points that are assigned to the cluster.
The centroid is simply a point which is the mean of the data points that belong to it (hence, "k-means").
Mathematically, the centroids are a point in n-dimensional space, where n is the number of features your data has.
The basic idea behind the k-means clustering algorithm is simple:
- Start with a chosen value of $k$.
- Choose $k$ of your data points at random to be your starting centroids.
- For each data point, assign it to a cluster based on which of the $k$ centroids it is closest to. Closest can mean any distance measure. The Euclidean distance is often used.
- Now you have $k$ groups of data points assigned to a cluster. Re-calculate the position of each cluster centroid by taking the mean of the new points that are now associated with that cluster.
- Repeat steps 3 and 4 until convergence. You are typically done when no points have changed clusters since the last iteration.
It's better to see this happen visually - here's a good interactive example.
The K-means Algorithm (with code)
Let's go through the steps again with code. Let's use the iris dataset.
Steps 1 & 2 - Initialisation
import pandas as pd
import numpy as np

df = pd.read_csv('iris.csv') # I'll supply this alongside the Jupyter notebook
# we don't need the target variable
df.drop('class', axis=1, inplace=True)


k = 3
centroids = []
clusters = []

# random initialisation of centroids = pick K data points at random as centroids
init_centroids = np.random.choice(range(len(df)), size=k, replace=False)

for i in init_centroids:
    # get the data point at index i
    pt = df.iloc[i,:]
    # append it to the centroids list
    centroids.append(pt.values)
Steps 3 & 4 - Learning
n_iterations = 10

def assign_to_cluster(idx):
    point = df.iloc[idx,0:4]
    # calculate distance (without sqrt) to each centroid
    distances = []
    for c in centroids:
        distances.append(((point - np.array(c)) ** 2).sum())
    # find index of closest cluster
    closest = np.argmin(distances)
    # assign point to that cluster
    clusters[closest].append(point.values)
    df.loc[idx,'cluster'] = closest

for _ in range(n_iterations):
    # first, reset the clusters
    clusters = []
    for i in range(k):
        clusters.append([])
    # assign each data point to nearest cluster
    for i in range(len(df)):
        assign_to_cluster(i)

    # now, recalculate the centroids
    for i in range(k):
        centroids[i] = np.array(clusters[i]).mean(axis=0)
First we've defined a function that calculates the distance between a data point and each of the cluster centroids. We can use the implementation trick where we don't need the actual Euclidean distance (to avoid the expensive square root operation). We then assign the data point to that cluster.
Then we iteratively assign points to the clusters and re-position the cluster centroids. With the new centroid positions, we assign points again, then re-calculate the centroids again and so on.
In this example I've forced it to run just 20 times, so there might still be room for improvement, but typically you'd run this until no points have changed cluster since the last iteration.
Once we've done that we can plot two of the data's dimensions and colour each point by its assigned cluster (and mark the cluster centroids).
We've gone from this plot of raw data:
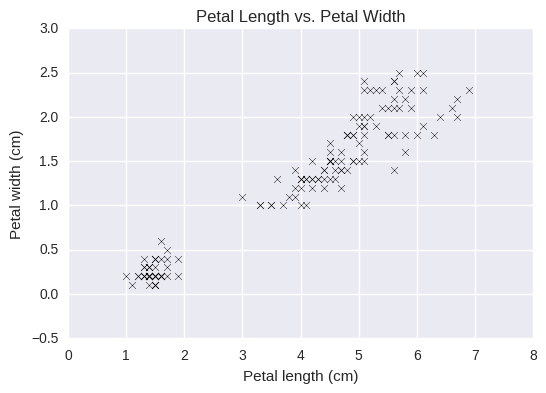
Plot of raw data before clustering
To this plot where we've clustered our points into 3 groups:
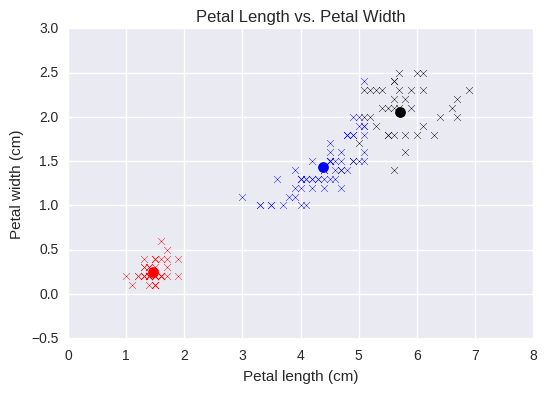
3 clusters after just 20 iterations
There is still some overlap between the black and blue clusters, but just 20 iterations have quite effectively grouped our data into 3 clusters.
That's all there is to it!
Here is the associated Jupyter notebook.
In Part 2, I'll talk about another practical application of the k-means algorithm (using scikit-learn this time) as well as some implementation details such as how to pick the value of $k$.

About David
I'm a freelance data scientist consultant and educator with an MSc. in Data Science and a background in software and web development. My previous roles have been a range of data science, software development, team management and software architecting jobs.