Introduction
When you learn about machine learning techniques, you usually get a selection of the usual suspects. Something like: Support Vector Machines, decision trees/random forests, and logistic regression for classification, linear regression for regression, k-means for clustering and perhaps PCA for dimensionality reduction.
In fact, KDNuggets has a good post about the 10 machine learning algorithms you should know.
If you want to learn about machine learning techniques, you should start there. The point is, on the subject of these algorithms the internet has you covered.
In this post I want to talk about a less prevalent algorithm, but one that I like and that can be useful for different purposes.
It's called a Self-Organising Map (SOM).
Brief History
SOMs are a type of artificial neural network. Some of the concepts date back further, but SOMs were proposed and became widespread in the 1980s, by a Finnish professor named Teuvo Kohonen. Unsurprisingly SOMs are also referred to as Kohonen maps.
Artificial Neural Networks
Artifical neural networks (ANNs) were designed initially to be a computational representation of what is believed to happen in the brain. The way signals are passed along an ANN is based on how signals pass between neurons in the brain.
ANNs are constructed as a series of layers of connected nodes. The first layer consists of your inputs, the last layer consists of your outputs, and there are any number of so-called hidden layers in between.
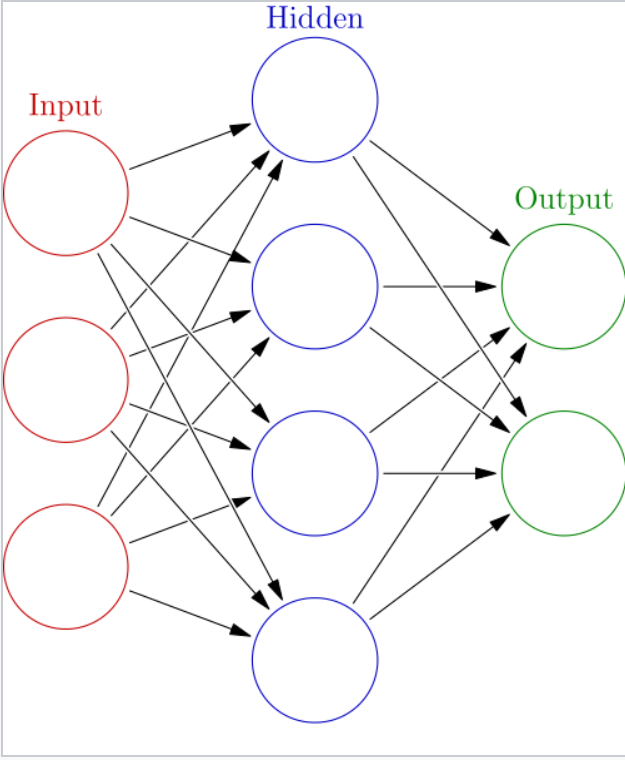
By Glosser.ca - [Own work], Derivative of File:Artificial neural network.svg, CC BY-SA 3.0, Link
The broad idea of an ANN is that you give it a dataset and a set of desired outputs, and it learns to map the inputs to the outputs. A classic example is teaching an ANN to recognise handwritten characters by giving it pixel values as inputs and the correct digit (say a number from 0-9) as the output.
During the training phase it learns the associations between pixel values and the digits. Then, you can give it a new set of inputs, digits it hasn't seen before, and it will be able to recognise them.
Here is such a system recognising characters in real time. It was built by Yann LeCun in the 1990s.
The way most ANNs "learn" a particular problem is by error-correcting. That is, during the training phase they adapt and improve based on the errors they make, and incrementally get better at solving the problem.
This is a supervised machine learning problem because you are telling the algorithm the desired answer for each set of inputs it's trained on, so it knows if it makes errors.
The SOM as an ANN
There are three main ways in which a Self-Organising Map is different from a "standard" ANN:
- A SOM is not a series of layers, but typically a 2D grid of neurons
- They don't learn by error-correcting, they implement something called competitive learning
- They deal with unsupervised machine learning problems
Competitive learning in the case of a SOM refers to the fact that when an input is "presented" to the network, only one of the neurons in the grid will be activated. In a way the neurons on the grid "compete" for each input.
The unsupervised aspect of a SOM refers to the idea that you present your inputs to it without associating them with an output. Instead, a SOM is used to find structure in your data.
What is a SOM used for?
This last point about unsupervised learning brings me to an important question, because abstract concepts like neural networks are great to talk about but I'm a practical kind of guy.
In that spirit then, what is a SOM used for?
Finding Structure
A classic example of what clustering algorithms are used for is finding similar customers in your customer base. SOMs can also do this. In fact, a SOM is meant to be a 2D representation of your multi-dimensional dataset. In this 2D representation, each of your original inputs, e.g. each of your customers, maps to one of the nodes on the 2D grid. Most importantly, similar (high-dimensional) inputs will map to the same 2D node, or at least the same region in 2D space. This is how the SOM finds and groups similar inputs together.
Dimensionality Reduction
Related to finding structure is the fact that by finding this structure a SOM finds a lower-dimensional representation of your dataset while preserving the similarity between your records.
That is, data points that are "nearby" in high-dimensional space will also be nearby in the SOM.
Visualisation
By creating a (typically) 2D representation of your dataset you can also more easily visualise it, which you can't do if your data has more than 3 dimensions.
Summary
To summarise, I'll quote an answer I gave on StackOverflow to a question about SOMs:
The idea behind a SOM is that you're mapping high-dimensional vectors onto a smaller dimensional (typically 2D) space. You can think of it as clustering, like in K-means, with the added difference that vectors that are close in the high-dimensional space also end up being mapped to nodes that are close in 2D space.
SOMs therefore are said to "preserve the topology" of the original data, because the distances in 2D space reflect those in the high-dimensional space. K-means also clusters similar data points together, but its final "representation" is hard to visualise because it's not in a convenient 2D format.
A typical example is with colours, where each of the data points are 3D vectors that represent R,G,B colours. When mapped to a 2D SOM you can see regions of similar colours begin to develop, which is the topology of the colour space.
Colours
I hope that sounds interesting, because in Part 2 of this post I'll discuss some concrete examples and walk through a Python implementation of Self-Organising Maps.
The example we'll be working with is using a 3D dataset of colours (where the 3 dimensions are R, G and B) and producing a 2D SOM where we visualise the "topology" of the 3D colour space.
Something like this:

In Part 2, we'll look at an in-depth implementation of SOMs.
About David
I'm a freelance data scientist consultant and educator with an MSc. in Data Science and a background in software and web development. My previous roles have been a range of data science, software development, team management and software architecting jobs.