Interpretability is often an important concern with a machine learning algorithm (despite spellcheck telling me it's not even a word). Having an accurate predictive model may be enough in itself, but in some cases the only way to turn it into a business decision is if you can understand why it's getting the results it's getting.
An obvious candidate for an interpretable classifier is a decision tree.
I won't go into the specifics of decision trees, Machine Learning Mastery has a good tutorial on the subject, but I'll just go over the intuition.
A decision tree is a series of if-then rules that decide what class a data point should belong to (in the case of a classification tree), or what value one of its properties should have (in the case of a regression tree).
If you've ever seen a flowchart, you can imagine a decision tree the same way.
A model might learn a decision tree that can be interpreted as something like "if the petal length is less than 2, classify the flower as setosa, otherwise if the petal width is greater than 1.5 classify it as virginica, otherwise classify it as versicolor".
You can train decision trees with Python using scikit-learn.
from sklearn.datasets import load_iris
from sklearn.tree import DecisionTreeClassifier
from sklearn.model_selection import train_test_split
from sklearn.metrics import accuracy_score

iris = load_iris()

X = iris.data
y = iris.target

X_train, X_test, y_train, y_test = train_test_split(X, y, test_size=0.3, stratify=y)

dt = DecisionTreeClassifier(min_samples_leaf=5, max_depth=3)
dt.fit(X_train, y_train)
I've set the maximum depth to 3, meaning it won't be grown beyond 3 levels, in this case purely for easier visualisation.
Once you're happy with a model, how do you visualise your tree?
Scikit-learn has a built-in function called export_graphviz which lets you export it to a file, in a specific format.
from sklearn.tree import export_graphviz

export_graphviz(dt, 'iris_tree.dot', feature_names=iris.feature_names)
You can then open the file in Notepad (or any text editor) and view its output online by pasting its contents into the textbox at http://webgraphviz.com
Our iris decision tree looks something like this:
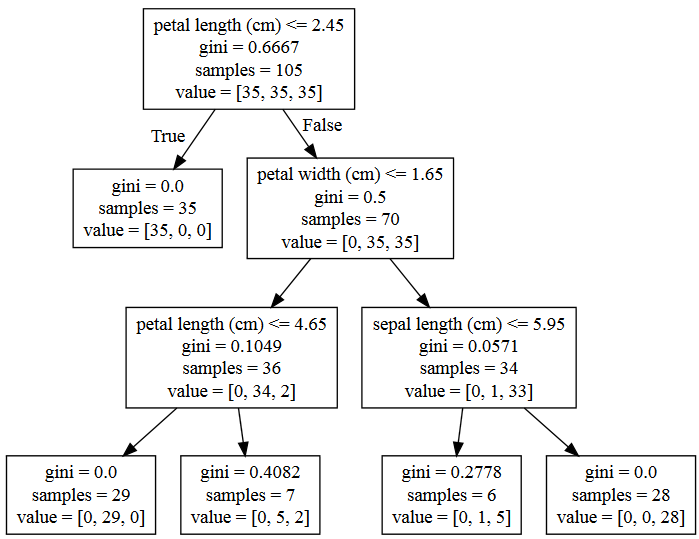
By providing the feature names we can label each decision point so it is obvious what's happening at each step.
The "value" part of each leaf node shows how the examples that make it to that node are split between the different classes.
I wasn't far off with my example - a petal length of 2.45cm separates the setosa class nicely, then a further separation using petal width, length and sepal length is enough to give us over 90% accuracy.
Once you get to deeper trees, this visualisation becomes ungainly, but if you want to keep the tree interpretable you probably want to limit its depth.
For further visualisation options you can follow the instructions on the official scikit-learn page.

About David
I'm a freelance data scientist consultant and educator with an MSc. in Data Science and a background in software and web development. My previous roles have been a range of data science, software development, team management and software architecting jobs.